

Appearance
Dashboard
The Customer Portal Dashboard is your operational summary. It shows the health of your tenants, your account metadata, and quick navigation into the parts of the portal you use most.
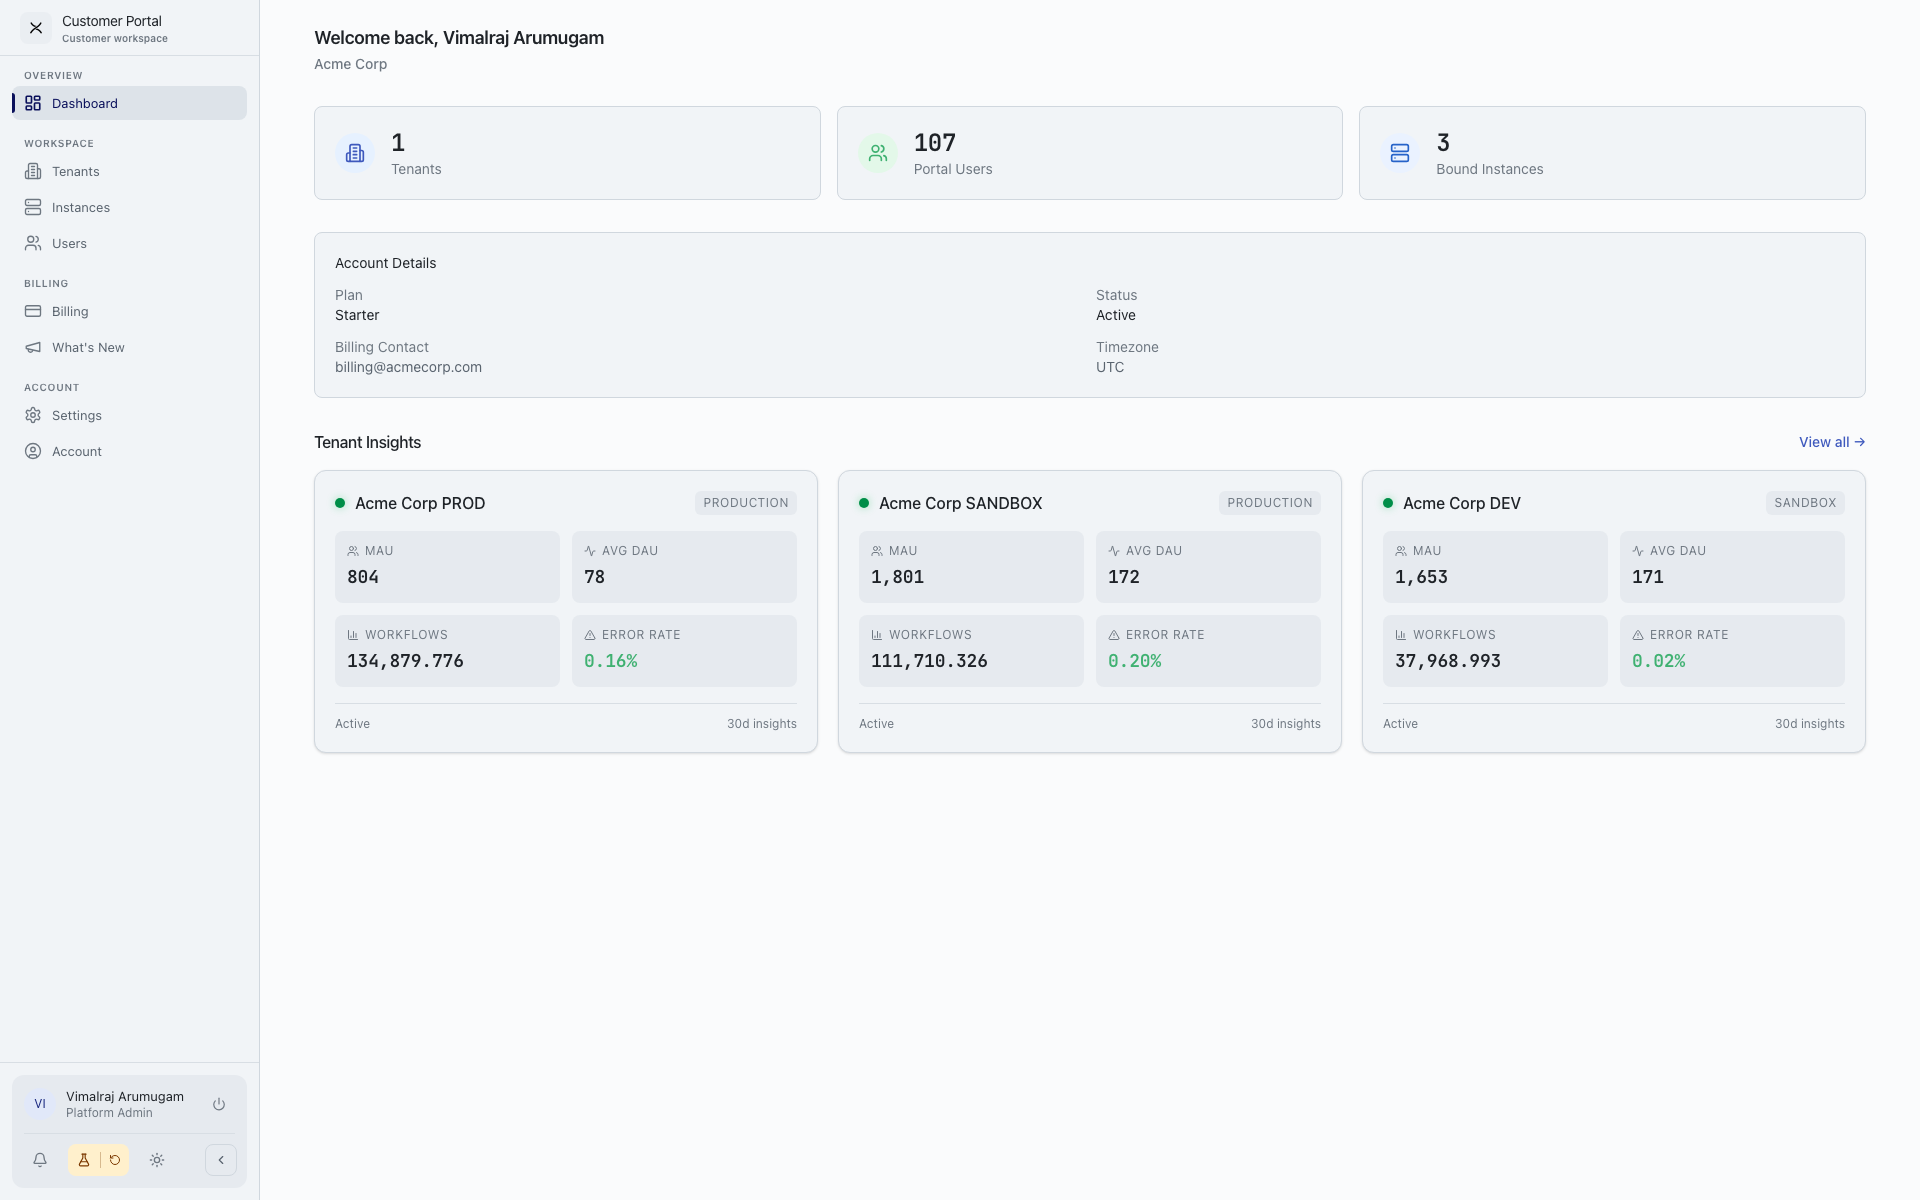
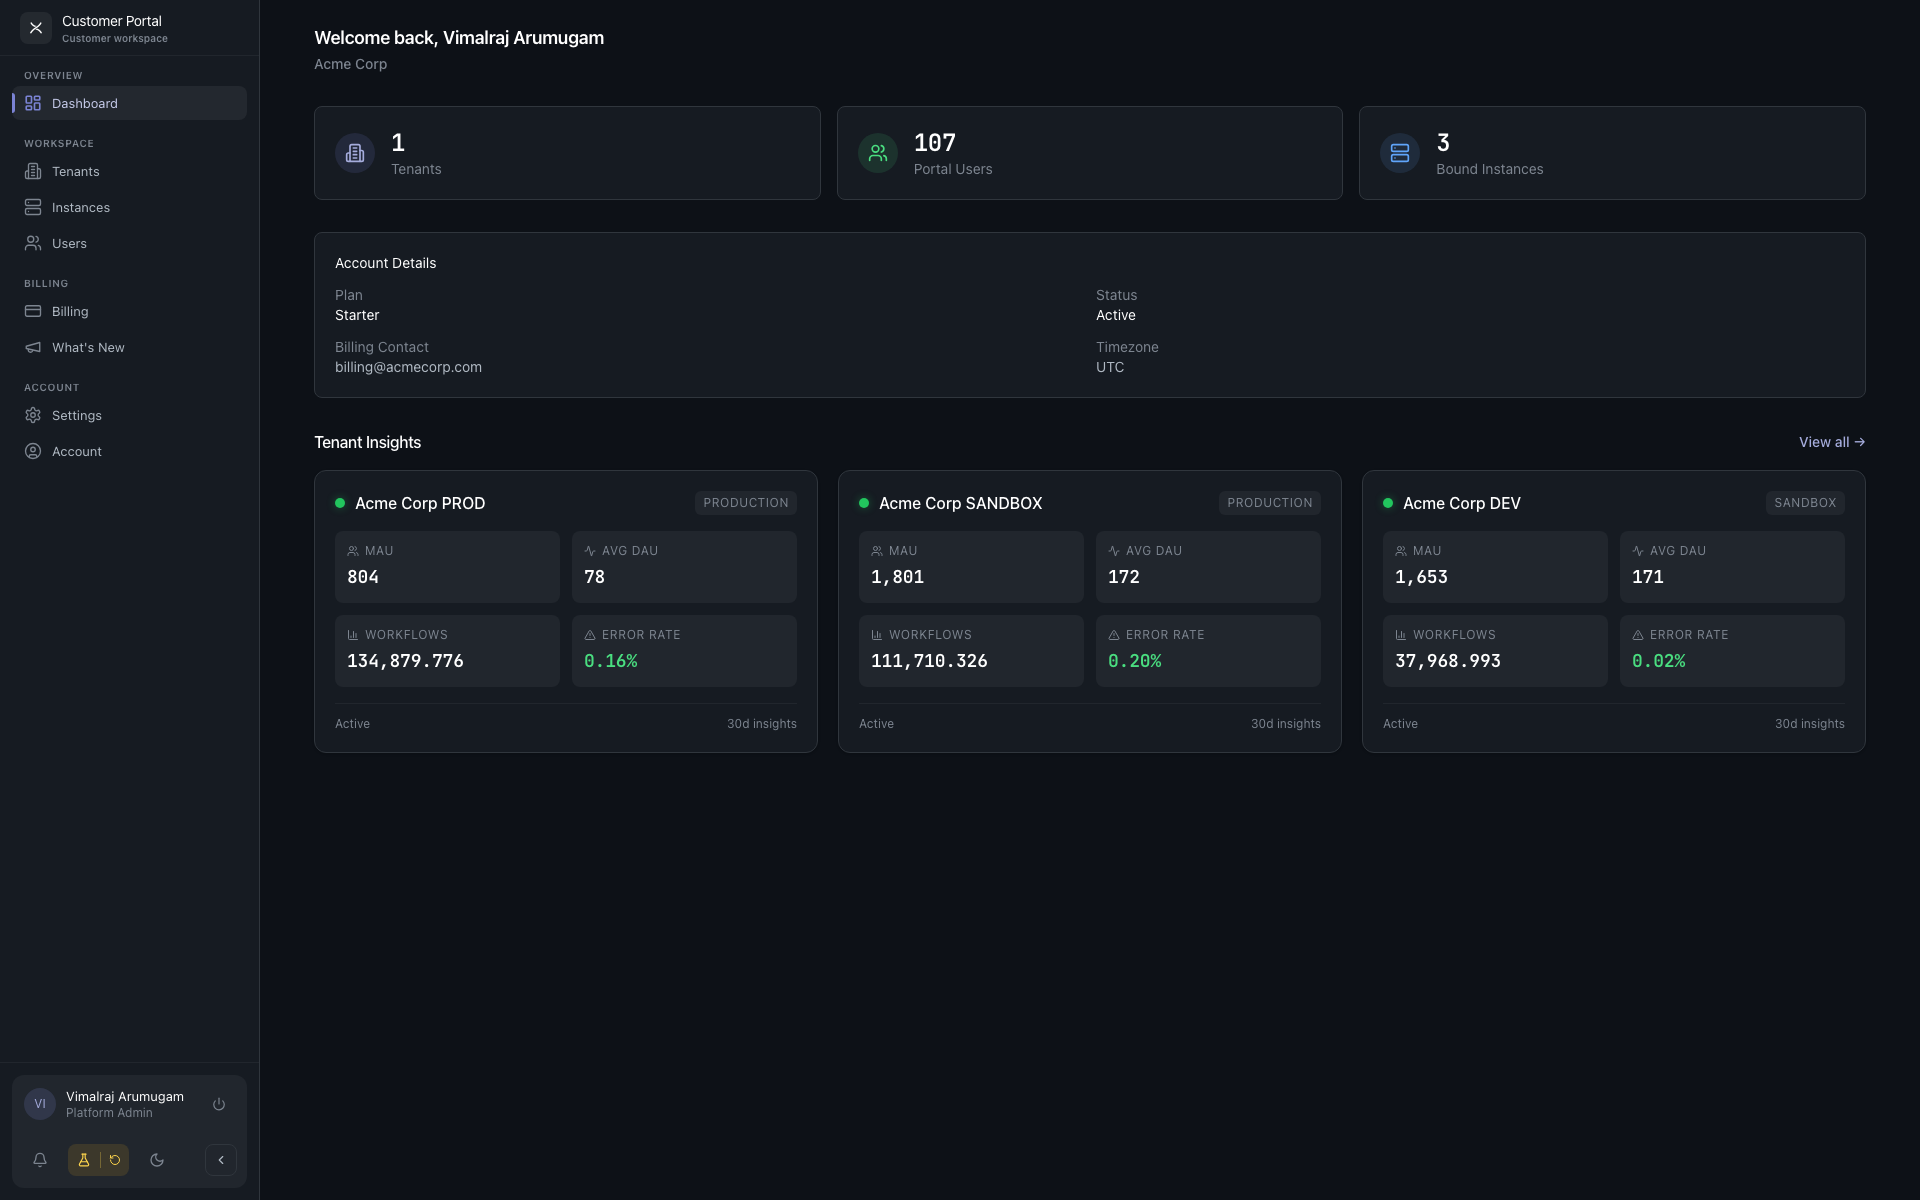
Layout
- A welcome header with your customer's name.
- Three metric cards:
- Tenants — number of tenants you own.
- Portal Users — number of users with access to your portal.
- Bound Instances — number of hosted instances that run your tenants.
- An Account Details card with Plan, Status, Billing Contact, and Timezone.
- A Tenant Insights grid — one card per tenant with key usage metrics and status.
Tenant insight card
Each tenant card shows:
- Name with environment badge (PROD / DEV / QA …).
- MAU (Monthly Active Users), Avg DAU (Daily Active Users), Workflows executed, Error Rate percentage.
- A status indicator (active / suspended / deleted).
- A 30-day indicator at the bottom.
Cards are colour-coded by error rate:
- Green — error rate under 1%.
- Red — error rate at or above 1%, or tenant status is suspended.
Click any card to jump to the tenant's full detail page.
The View all link in the section header takes you to Tenants.
What this page is good for
- A morning check to confirm everything is healthy.
- Spotting a tenant whose error rate has spiked.
- Confirming your portal user count and plan are what you expect.
Permissions
This page requires the view_dashboard portal action. If your role does not have it, you will not see the Dashboard in the sidebar — your home page becomes the next available page.