

Appearance
Admin Console Overview
The Admin Console is the workspace for Exto operators. It exposes every customer, tenant, instance, release, and billing record in the platform, gated by your internal role and scope.
Sidebar map
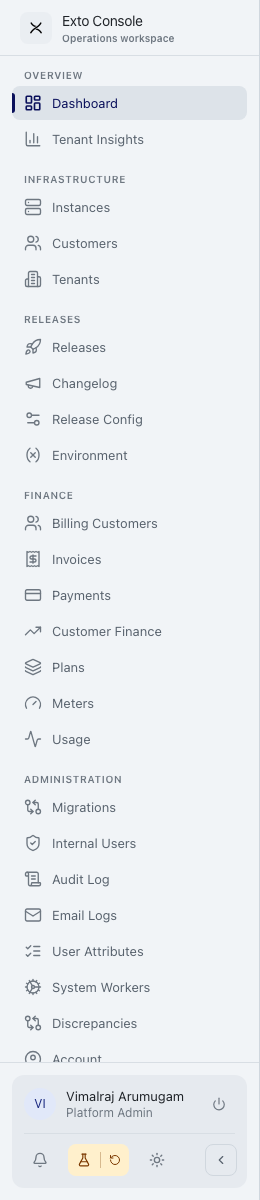
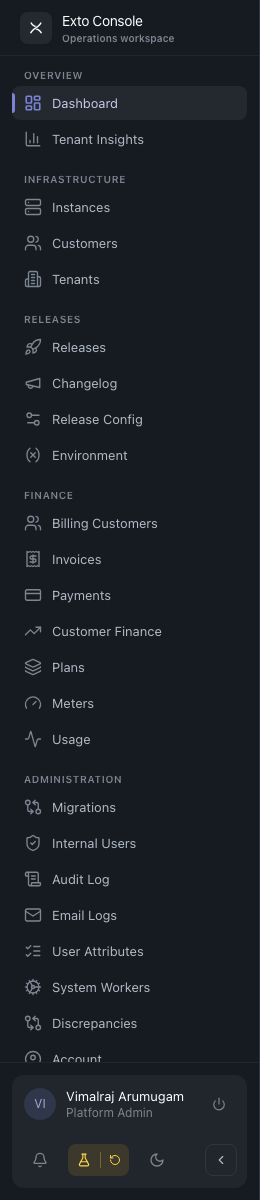
The left-hand sidebar is organised by domain:
| Section | What lives here |
|---|---|
| Dashboard | Platform health and recent activity at a glance. See Dashboard. |
| Customers | The companies you sell to. Create, suspend, churn, and manage. See Customers. |
| Tenants | Customer environments running on instances. See Tenants. |
| Tenant Insights | Fleet-wide tenant usage analytics. See Tenant Insights. |
| Instances | Hosted environments (clusters) that run tenants. See Instances. |
| Migrations | Tenant clones, deletes, exports, imports, and instance replaces. See Migrations. |
| Internal Users | Exto operators and their roles. See Internal Users. |
| User Attributes | Custom profile fields for customer users. See User Attributes. |
| Releases | New releases and their pipeline status. See Releases. |
| Release Configuration | Global pipeline, approval, and SLA settings. See Release Configuration. |
| Changelog | Customer-facing release notes. See Changelog. |
| Environment Variables | Global variables and per-instance overrides. See Environment Variables. |
| Finance | Plans, meters, customers, invoices, payments, usage. See Finance Overview. |
| Audit Log | Every action recorded against its actor. See Audit Log. |
| Email Logs | Outbound notification history. See Email Logs. |
| System → Workers | Background worker health. See System Workers. |
| System → Discrepancies | Triage inbox for dangling tenant data. See Discrepancies. |
What you can see
Your internal role and scope determine what is visible:
- Platform Admins and Infra Ops see everything across the platform.
- Account Managers see only customers in their scope. Other customers are hidden, not just locked.
- QA Admins see only customers in their customer scope and may operate on instances in their instance scope.
See Roles & Permissions.
Common patterns
The Admin Console is consistent across pages. Once you have used a few list views, the rest is familiar:
- List pages show a toolbar (search, filter dropdowns, Clear button) above a sortable table. The count to the right of the toolbar shows filtered vs. total rows.
- Detail pages open from clicking a row. They have a header with status, a primary action set, and one or more tabs.
- Destructive actions (suspend, churn, delete, decommission) always open a confirmation modal — usually with a required reason field.
- Status badges are colour-coded everywhere: green = healthy, orange = warning, red = problem, grey = retired.
- Timestamps are relative on lists ("2 hours ago") and absolute on detail pages, with the full date available on hover.
- Row actions appear as icon buttons in the rightmost column, sometimes on hover.
Focus mode
If you operate against a single customer for a while, click Focus on this customer on the customer's detail page. While focused, the Dashboard and other aggregate views narrow to just that customer's data. Exit focus from the same control.