

Appearance
Dashboard
The Dashboard is the platform-wide health view that operators see first after sign-in. It is read-only — every action is a drill-down to the page where you actually do work.
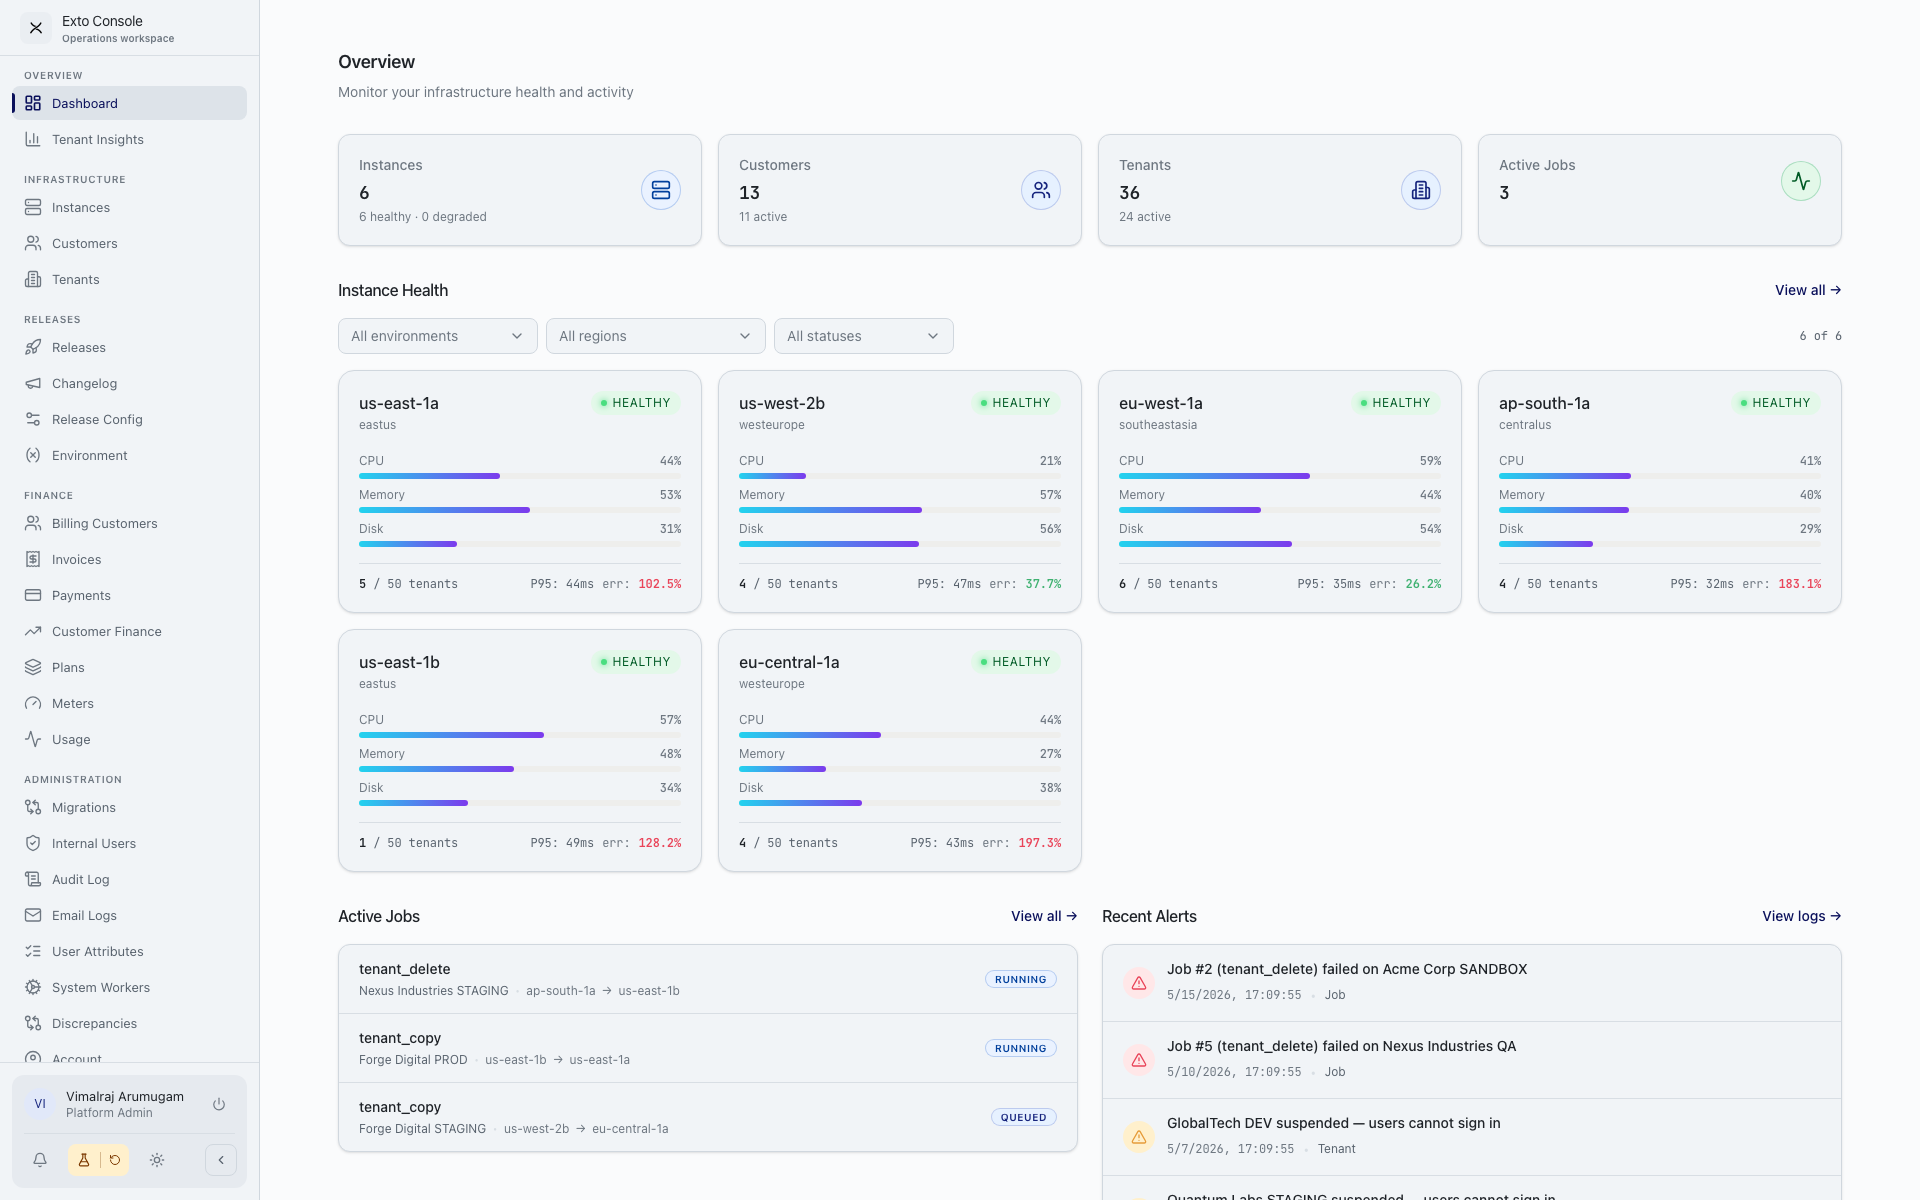
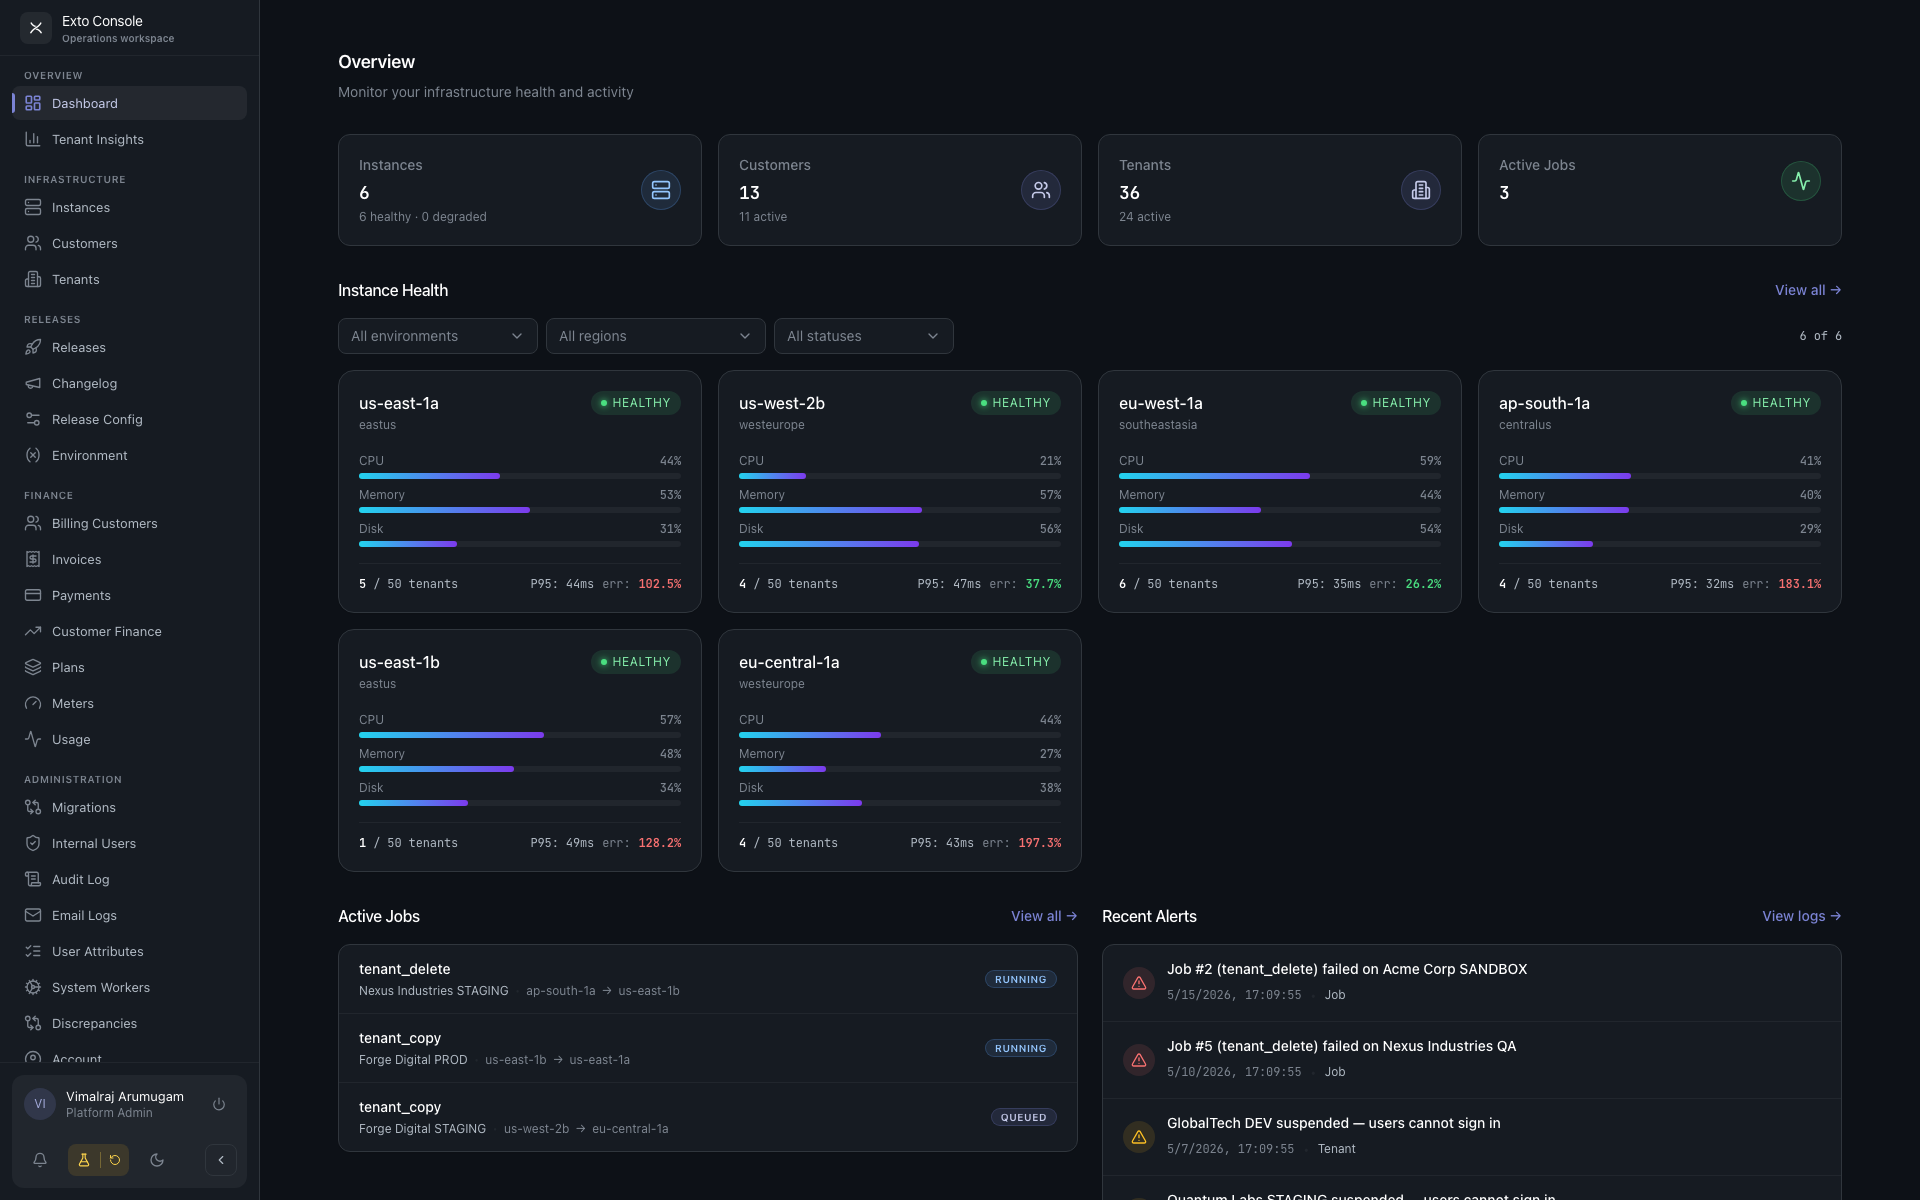
Layout
The page has four bands, top to bottom.
1. Summary cards
Four headline numbers across the top:
- Instances — total instances across the fleet.
- Customers — total customer accounts. Hidden in focus mode.
- Tenants — total provisioned tenants.
- Active Jobs — currently running migration jobs (clones, deletes, imports, instance replaces).
In focus mode (when you are focused on a single customer), the Customers card disappears and the other numbers narrow to the focused customer's scope.
2. Instance Health
A grid of instance cards. Each card shows:
- Instance name and region tag
- Health status badge (Healthy / Degraded / Warning) with a coloured indicator
- CPU, memory, and disk usage as progress bars
- Tenant capacity (active / max)
- P95 latency and error rate
Cards are clickable — they take you to the instance detail page.
Above the grid is a filter toolbar (Environment, Region, Status) and a count chip showing filtered vs. total. A Clear All button appears when any filter is active. The "View all" link in the header jumps to the Instances page.
Card colour reflects state: green for active, red for degraded, orange for provisioning or maintenance.
3. Active Jobs (left)
A list of migration jobs currently running. Each row shows the job type, the affected tenant, the source-to-target migration path, and a status badge. "View all" takes you to Migrations.
4. Recent Alerts (right)
A list of recent alert events with timestamps and entity-type chips. Each row uses an icon to indicate severity (error, warning, success). "View logs" jumps to the Audit Log.
Empty states
If there are no active jobs or no recent alerts, the respective panel shows a friendly empty-state icon and message. You will see this on a quiet platform — it is not a problem.
Notes
- The Dashboard does not auto-refresh. To see the latest state, reload the page.
- Health metrics are aggregated from instance heartbeats; if an instance's heartbeat is stale, its card grays out and the rolled-up numbers drop accordingly.
- Sync errors on tenants are not surfaced here — drill into the affected instance to see them.