

Appearance
Tenant Insights
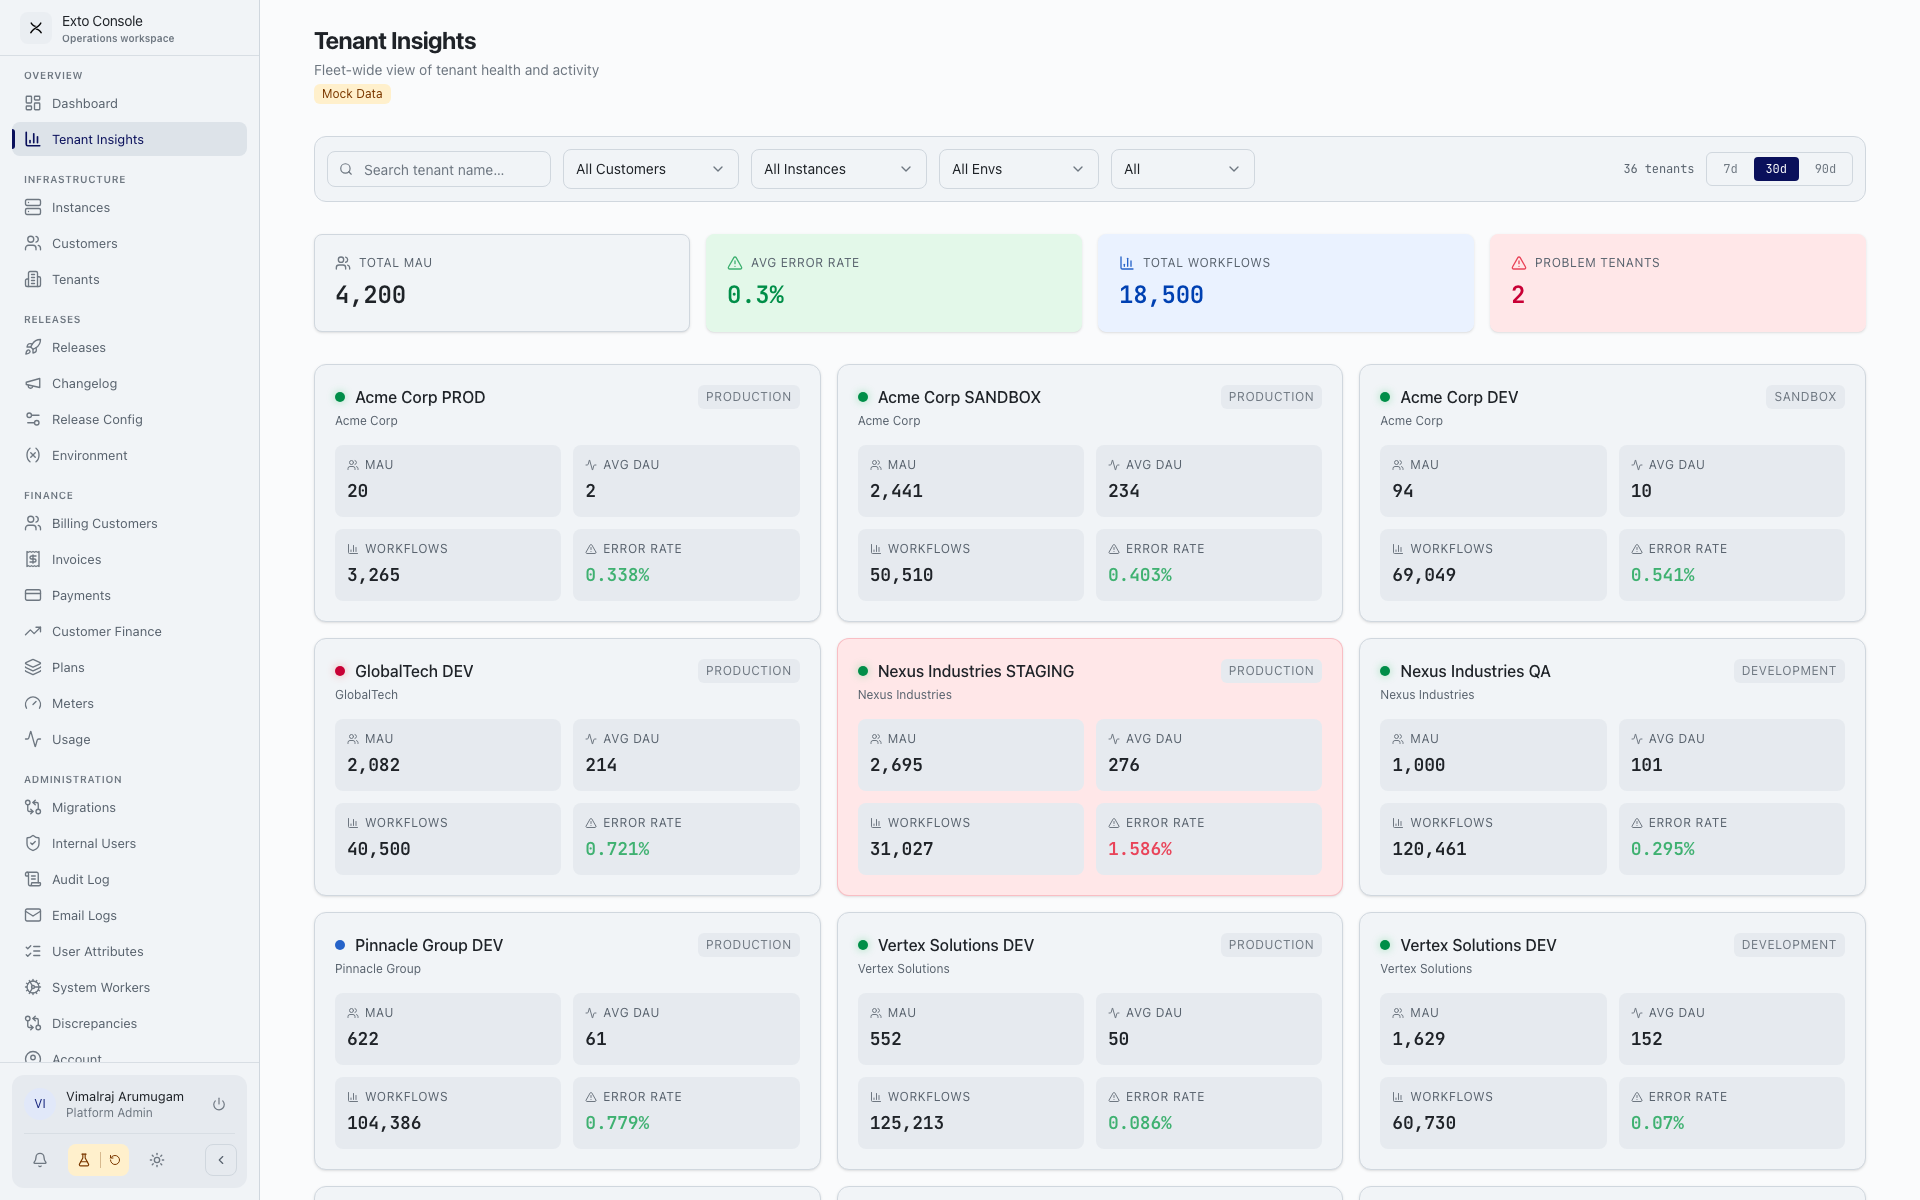
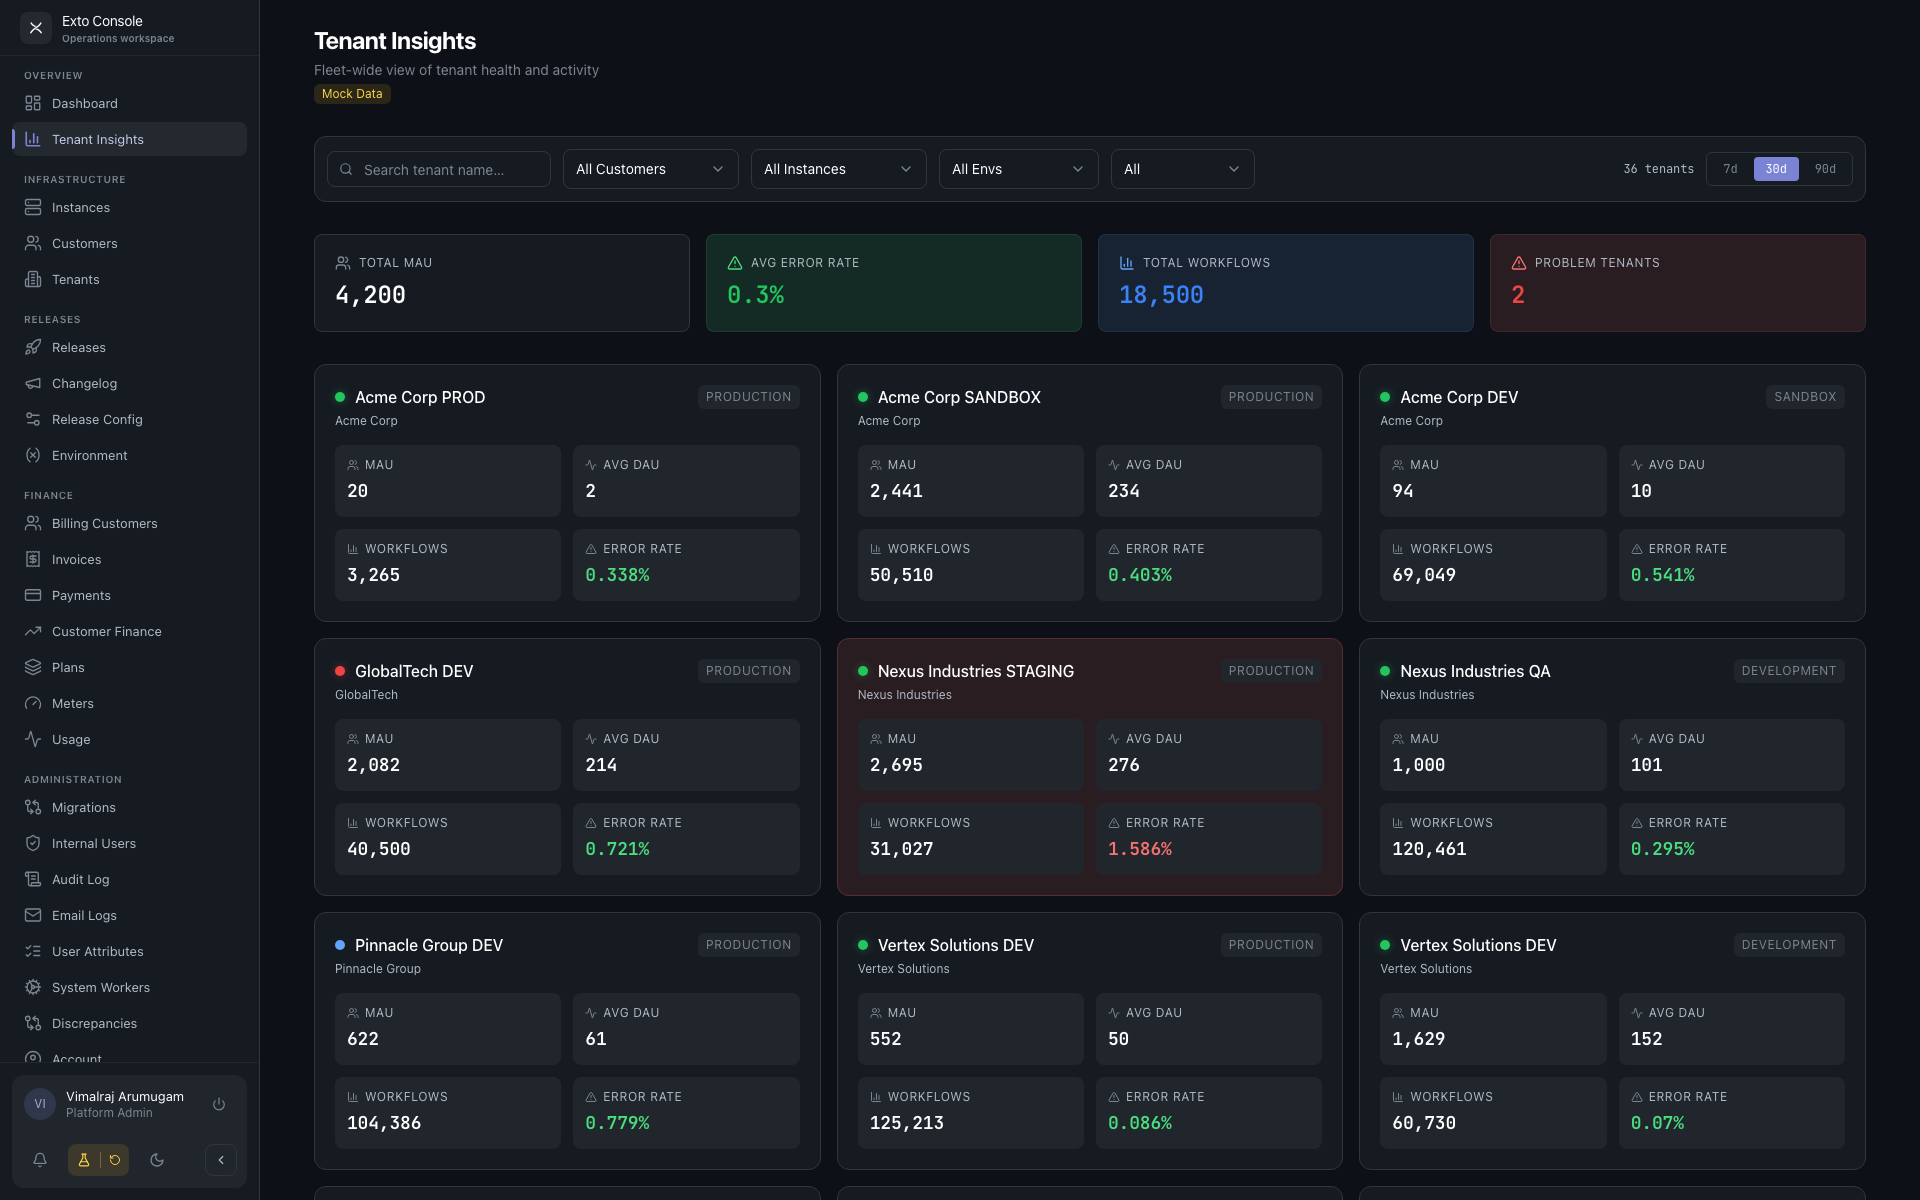
Tenant Insights is the fleet-wide analytics view. Where the Tenants page is for lifecycle operations, this page is for spotting usage patterns and problem tenants across the entire platform.
Layout
Top to bottom:
- Filter bar — search, customer filter, instance filter, environment filter, status filter, date-range toggle (7d / 30d / 90d), and an optional Problem tenants only toggle in the summary card area.
- Summary cards — Total MAU, Avg Error Rate, Total Workflows, Problem Tenants count. Clicking the Problem Tenants card filters the grid to problem tenants only.
- Tenant grid — paginated, 24 cards per page, with a Load More button.
Tenant insight card
Each card represents one tenant.
- Name with environment badge.
- Customer name in secondary text.
- Four metric boxes: MAU, Avg DAU, Workflows, Error Rate.
- A coloured border if the tenant is in trouble: red for error rate ≥ 1%, otherwise neutral.
- A status dot in the corner (green / red / orange / grey).
Click a card to jump to that tenant's detail page (Insights tab pre-selected).
Filters
| Filter | Behaviour |
|---|---|
| Search | Tenant name match. |
| Customer | Single customer scope. |
| Instance | Single instance scope. |
| Environment | DEV / QA / UAT / etc. |
| Status | All / Active / Suspended / Provisioning / Deleted. |
| Date Range | 7d / 30d / 90d. Affects every metric on the page. |
| Problem tenants | Toggle in the summary cards. Shows only tenants where error rate ≥ 1%. |
What counts as a "problem tenant"?
A tenant is flagged as a problem when its average error rate in the selected date range is ≥ 1%. The metric is the same one shown on the card itself. There is no escalation or status change — the flag is informational.
Notes
- Each card fetches its own metrics lazily as it scrolls into view. You will see brief spinners on freshly visible cards.
- The page shows real data unless the Mock Data badge is visible in the header — that indicates a development feature flag, not real consumption.
- Empty results show a friendly empty state with the active filter summary.